Homes in Washington Park
Washington Park is the best-known parks in the metro Denver area. Located just north of I-25 near South Pearl Street, the area features numerous art galleries, wine and cocktail bars, exclusive boutiques, and a variety of fine dining establishments. Nearby retail conveniences are in abundance at Bonnie Brae and Old South Gaylord, in addition to Cherry Creek Mall.
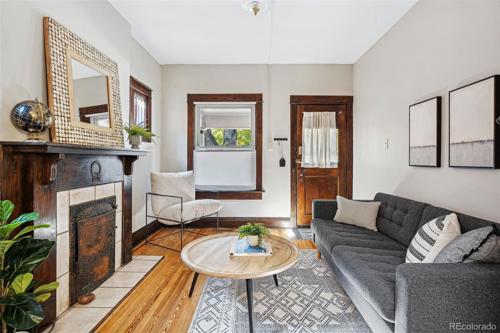
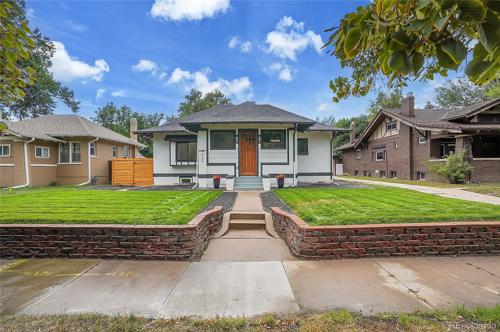
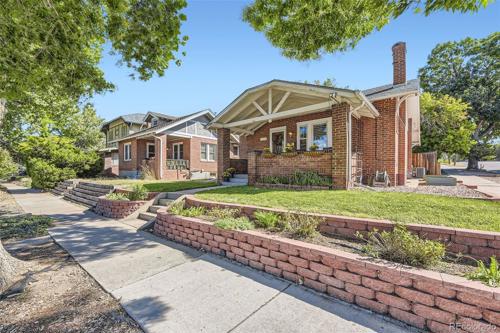
The homes in Washington Park are characterized by a variety of historic brick bungalows, Denver Squares, Victorian, Queen Anne’s, and several new builds in selected areas. Homes are nicely maintained with well-manicured yards featuring mature trees.
The 155-acre park is a sanctuary for cyclists, walkers, joggers and others. The park hosts soccer leagues, tennis clubs, flag football competition, and there are volleyball courts and sports playing fields. There are two lakes, two huge flower gardens, including one that is a replica of George Washington’s garden at Mount Vernon in Virginia.
The neighborhood also includes a recently renovated recreation center that hosts multiple fitness events, including the Thanksgiving Turkey Trot and the spring Furry Scurry, which draw enthusiastic crowds from throughout the metro area. You can also enjoy several outdoor festivals during the summer months.
List of Zipcodes in Homes in Washington Park
| Zip Code | Zip Code Name | Zip Code Population |
|---|---|---|
| 80209 | Denver | 25,902 |
Source: Census Bureau
Demographics
State
Colorado
County
Denver County
City
Denver
Population
734,508
| Zip Code | City | County | State | National | |
|---|---|---|---|---|---|
| Population | 25,902 | 734,508 | 734,331 | 5,759,582 | 331,426,769 |
| Population Density | 7,437.8 | 4,794.0 | 4,799.5 | 55.5 | 93.8 |
| Percent Male | 49.0% | 50.0% | 50.0% | 49.0% | 49.0% |
| Percent Female | 51.0% | 50.0% | 50.0% | 51.0% | 51.0% |
| Median Age | 41.4 | 37.6 | 37.6 | 40.2 | 39.0 |
| People per Household | 1.8 | 2.2 | 2.2 | 2.8 | 2.6 |
| Median Household Income | $97,018 | $69,660 | $69,646 | $115,942 | $61,963 |
| Average Income per Capital | $79,171 | $45,195 | $45,172 | $50,725 | $33,235 |
Source: Census Bureau
Market Data
| Zip Code | City | County | State | National | |
|---|---|---|---|---|---|
| Median Sale Price | $795,000 | $485,000 | $485,000 | $425,100 | $277,796 |
| Median Age of Home | 54.0 | 56.0 | 56.0 | 39.0 | 49.0 |
| Homes Owned | 49.0% | 46.0% | 46.0% | 67.0% | 58.0% |
| Homes Rented | 42.0% | 46.0% | 46.0% | 23.0% | 31.0% |
| Homes Vacant | 9.0% | 7.0% | 7.0% | 4.0% | 11.0% |
Sources: Census Bureau / Homendo
Source: REcolorado
This free service is provided by your local Agent
How much is your Home worth? Click here to know...
Review current market value estimates for your home, or anyone else, anywhere in the USA.
48 properties on market in Homes in Washington Park
 Active
Residential
MLS# 8076695 | 2024-12-03T16:09:17.049Z
 Active
Residential
MLS# 3549000 | 2024-12-02T22:04:16.251Z
 Active
Residential
MLS# 3478542 | 2024-12-01T23:05:17.145Z
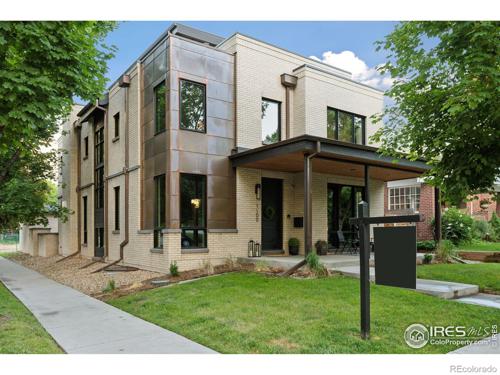 Active
Residential
MLS# IR1015640 | 2024-12-01T18:05:17.650Z
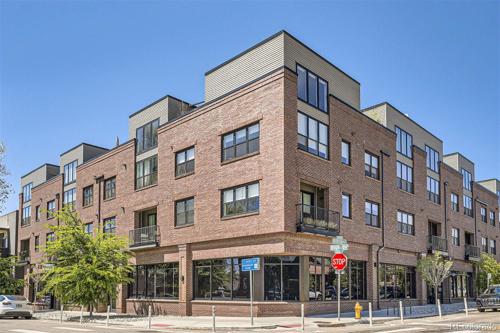 Active
Condominium
MLS# 2725903 | 2024-11-30T22:44:16.118Z
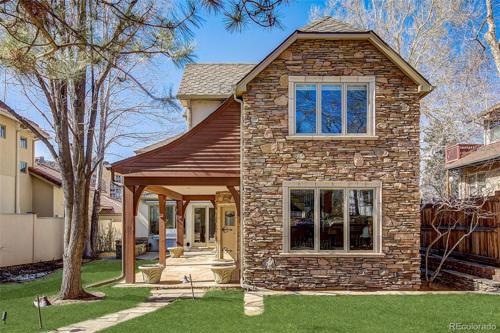 Active
Residential
MLS# 5547980 | 2024-11-30T22:05:16.588Z
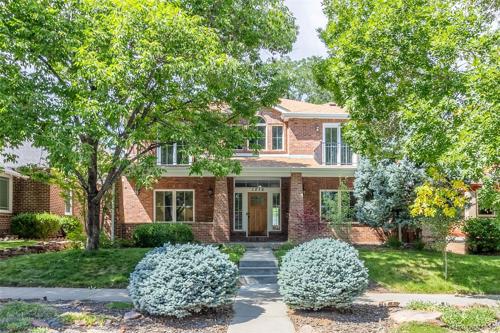 Active
Residential
MLS# 2321244 | 2024-11-25T22:31:16.276Z
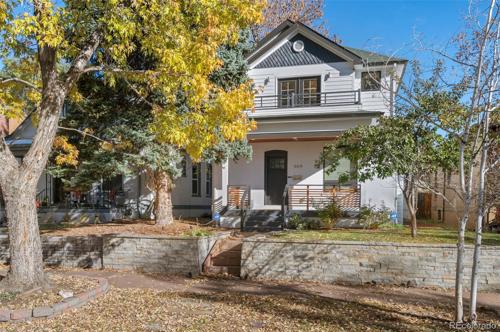 Active
Residential
MLS# 2187602 | 2024-11-25T20:37:16.185Z
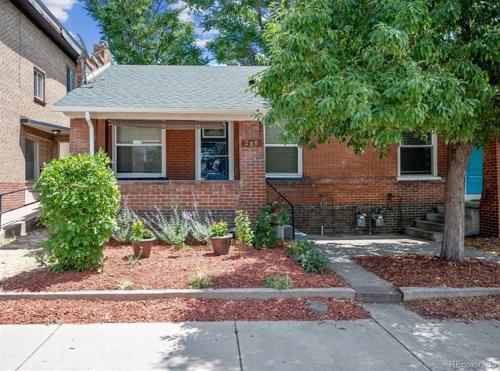 Active
Residential
MLS# 7517882 | 2024-11-25T03:06:16.082Z
This free service is provided by your local Agent
Need more listings? Click here to search now...
15 minutes updated and accurate properties direct from your local agent. Home Evaluation. Get Loan Pre-Qualified.
Mary Ann Hinrichsen
RE/MAX Professionals
6020 Greenwood Plaza Boulevard
Greenwood Village, CO 80111, USA
6020 Greenwood Plaza Boulevard
Greenwood Village, CO 80111, USA
- (303) 548-3131 (Mobile)
- Invitation Code: new-today
- maryann@maryannhinrichsen.com
- https://MaryannRealty.com
Contact Me
Quality of Life
Cost of Living
77.0
Health Cost Index
84.0
Commute Time
20.0
Working from Home
6.0%
| Zip Code | City | County | State | National | |
|---|---|---|---|---|---|
| Cost of Living Index | 77.0 | 86.0 | 86.0 | 110.0 | 100.0 |
| Health Cost Index | 84.0 | 96.0 | 96.0 | 119.0 | 100.0 |
| Commute Time | 20.0 | 24.0 | 24.0 | 25.0 | 24.8 |
| Commuting by Bus | 8.0% | 9.0% | 9.0% | 1.2% | 2.1% |
| Commuting by Carpool | 7.0% | 14.0% | 14.0% | 11.0% | 13.5% |
| Commuting by Auto | 79.0% | 73.0% | 73.0% | 80.0% | 79.1% |
| Working at Home | 6.0% | 4.0% | 4.0% | 5.2% | 4.7% |
Source: Census Bureau
Walk Score®
Source: Walk Score®
Climate & Environment
January Average Low Temperature
15.2 °F
July Average High Temperature
88.0 °F
Annual Precipitation (inch)
16 inches
| Zip Code | City | County | State | National | |
|---|---|---|---|---|---|
| January Average Low Temperature | 15.2 °F | 15.2 °F | 15.2 °F | 13.7 °F | 22.6 °F |
| July Average High Temperature | 88.0 °F | 88.0 °F | 88.0 °F | 77.5 °F | 86.1 °F |
| Annual Precipitation (inch) | 16 in. | 16 in. | 16 in. | 19 in. | 38 in. |
Source: NOAA Climate
Schools & Education
Source: Great Schools
Safety & Crime
Violent Crimes
247.6
Property Crimes
1,580
| Zip Code | City | County | State | National | |
|---|---|---|---|---|---|
Violent CrimesCalculated annually per 100,000 residents |
|||||
| Assault | 121.8 | 204.6 | 476.6 | 246.3 | 250.2 |
| Murder | 2.18 | 2.5 | 9.2 | 3.8 | 5.0 |
| Rape | 69.83 | 71.4 | 97.8 | 67.2 | 42.6 |
| Robbery | 53.72 | 64.4 | 165.3 | 63.6 | 81.6 |
Property CrimesCalculated annually per 100,000 residents |
|||||
| Burglary | 347.4 | 347.5 | 544.2 | 348.4 | 340.5 |
| Theft | 611.7 | 1,840.0 | 2,473.0 | 1,858.3 | 1,549.5 |
| Motor Vehicle Theft | 611.7 | 603.4 | 726.3 | 384.0 | 219.9 |
Source: FBI - Crime Data Explorer


 Menu
Menu


